Superset dashboards
After running drift queries in Superset SQL Lab, you can save results as datasets, create charts, and build monitoring dashboards for ongoing visibility into model drift.
Save query results as a dataset
To reuse a drift query result in charts and dashboards, save it as a dataset:
-
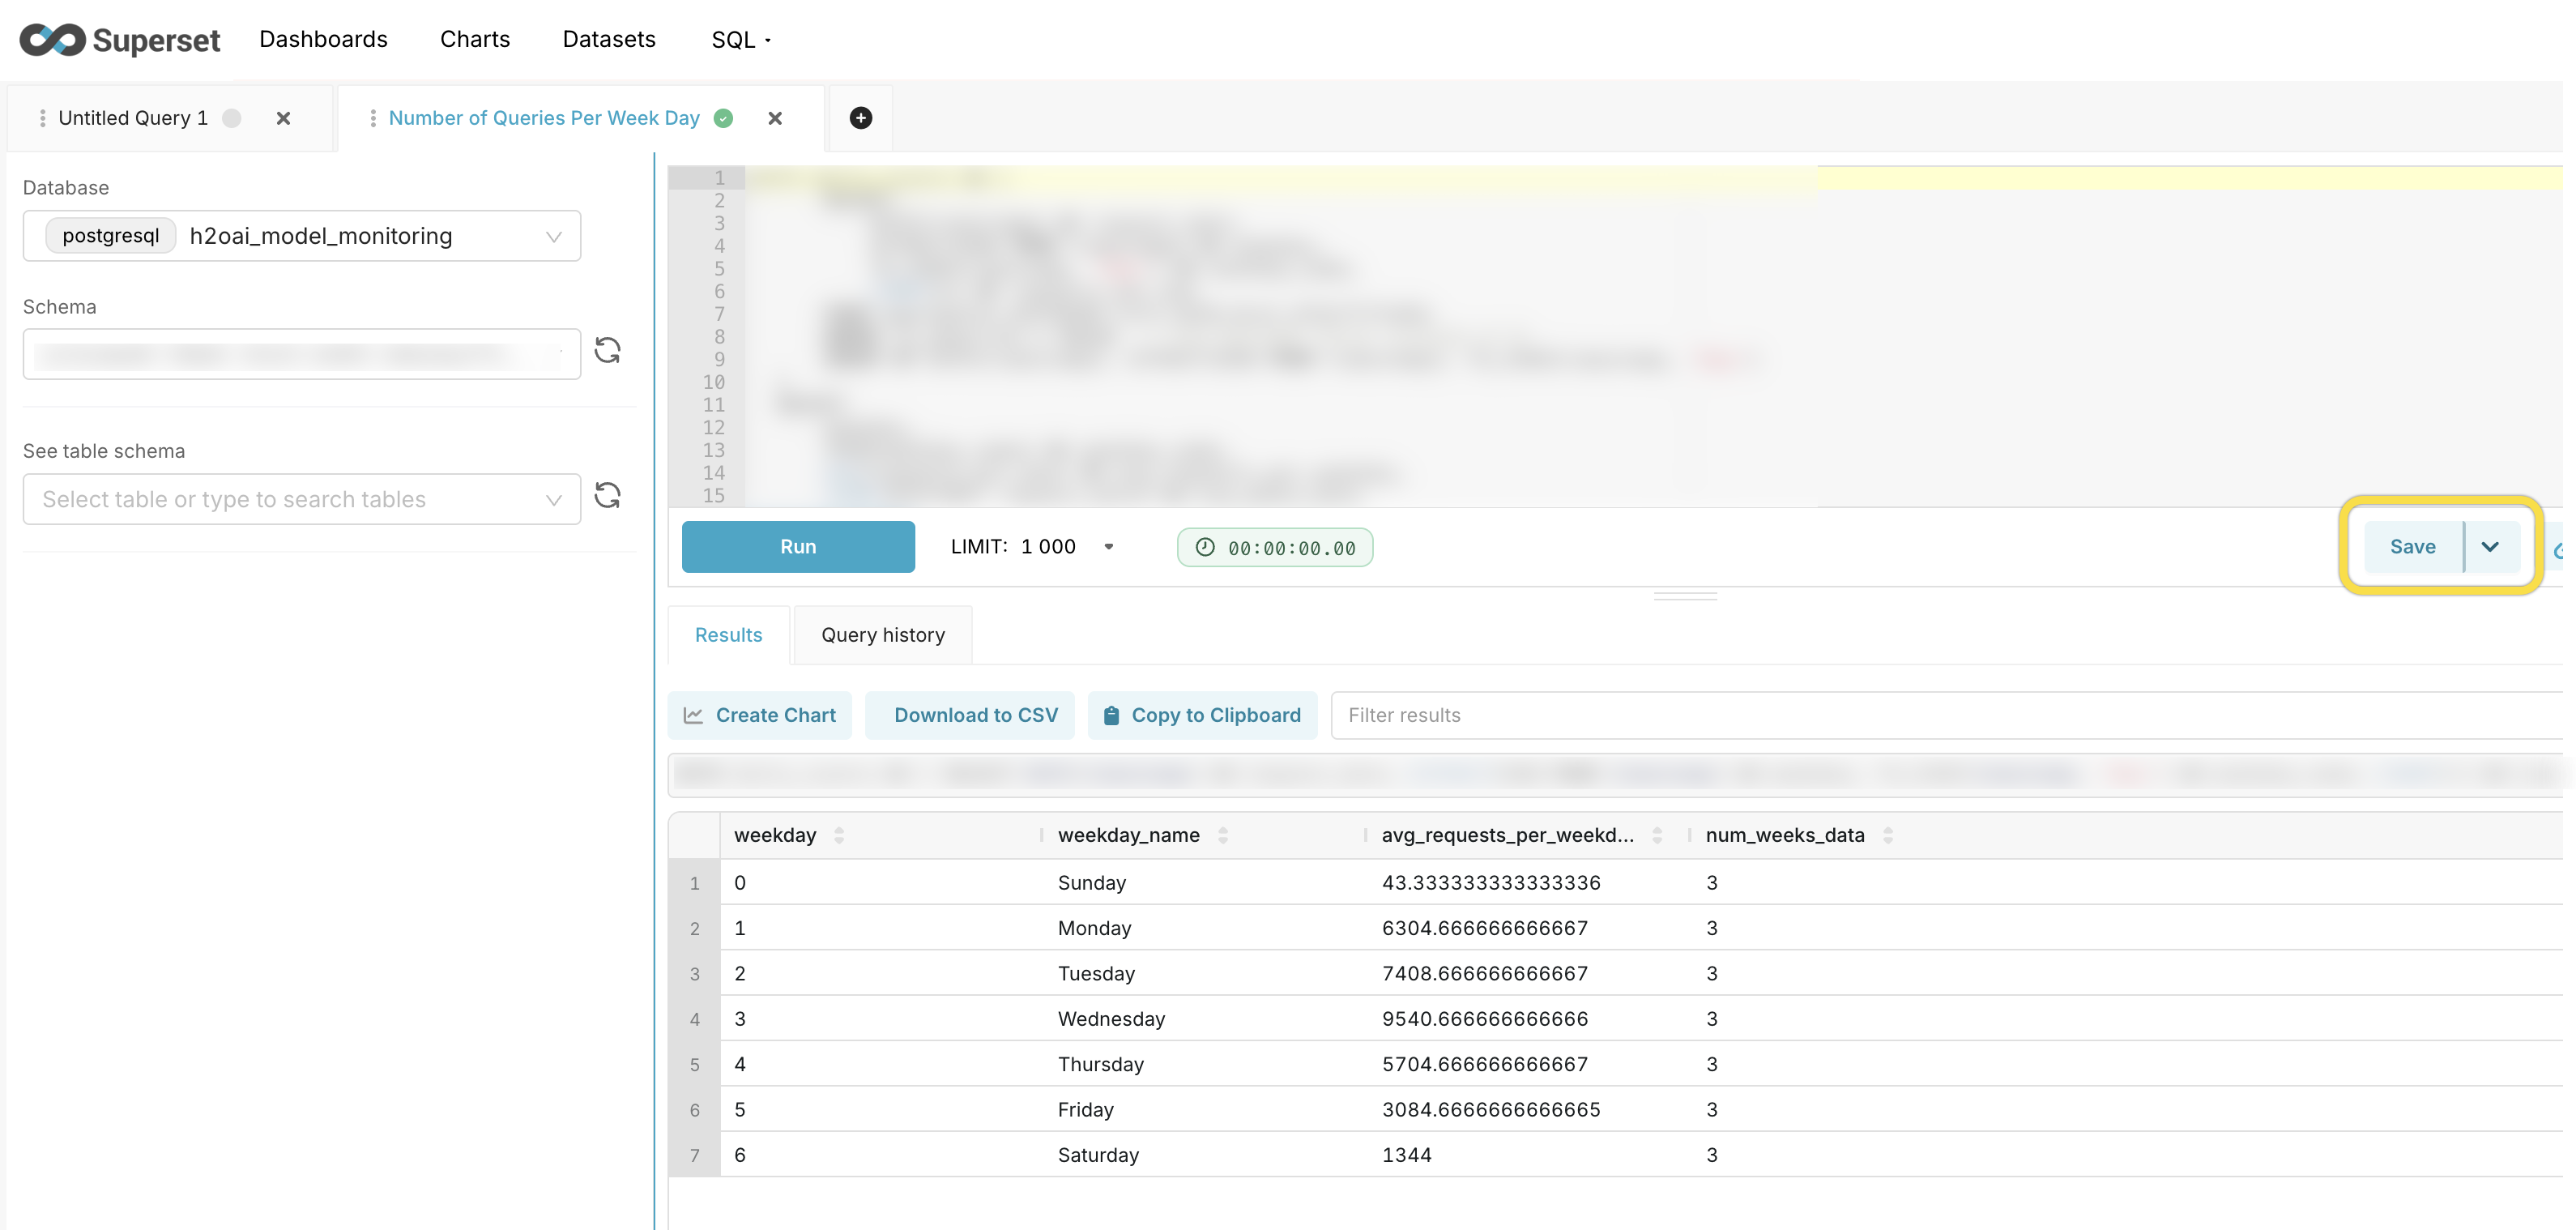
Run your drift query in SQL Lab.
-
From the Save drop-down, select Save dataset.
-
Enter a descriptive name for the dataset (for example,
tvd_drift_age_columnorpsi_categorical_drift). -
Click Save.
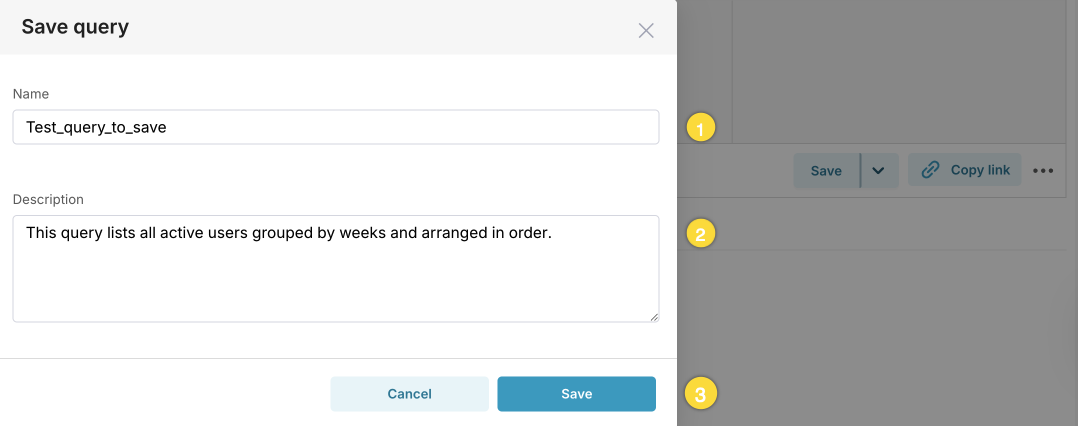
Use a consistent naming convention for datasets, such as <drift_method>_<feature_name> (for example, tvd_drift_age, psi_drift_gender). This makes it easier to identify datasets when building dashboards.
Create a chart
To visualize drift data as a chart:
-
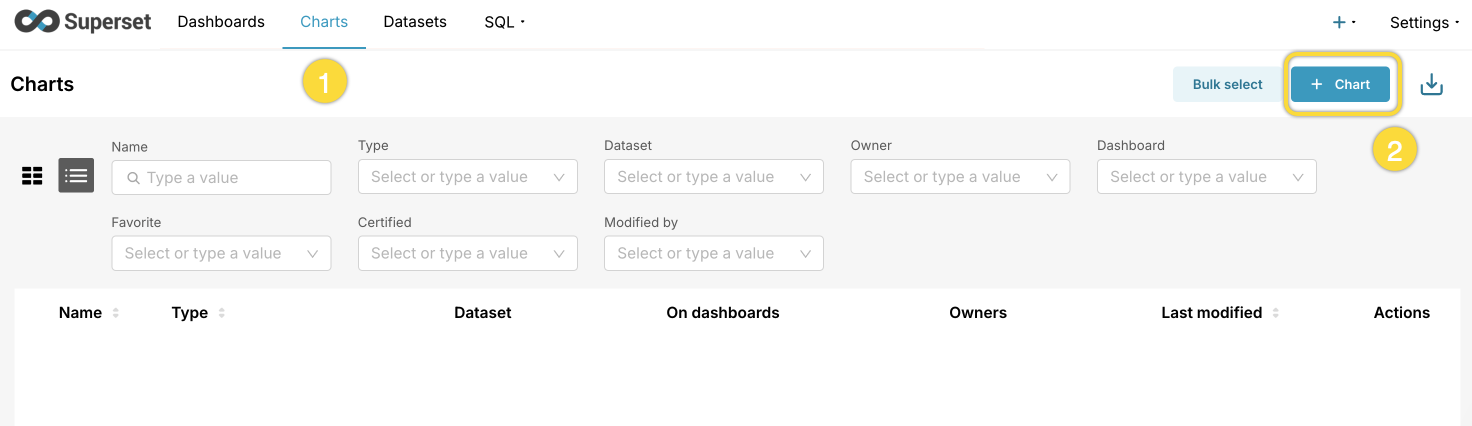
Go to Charts and click + Chart.
-
Select the dataset you saved.
-
Choose a chart type.
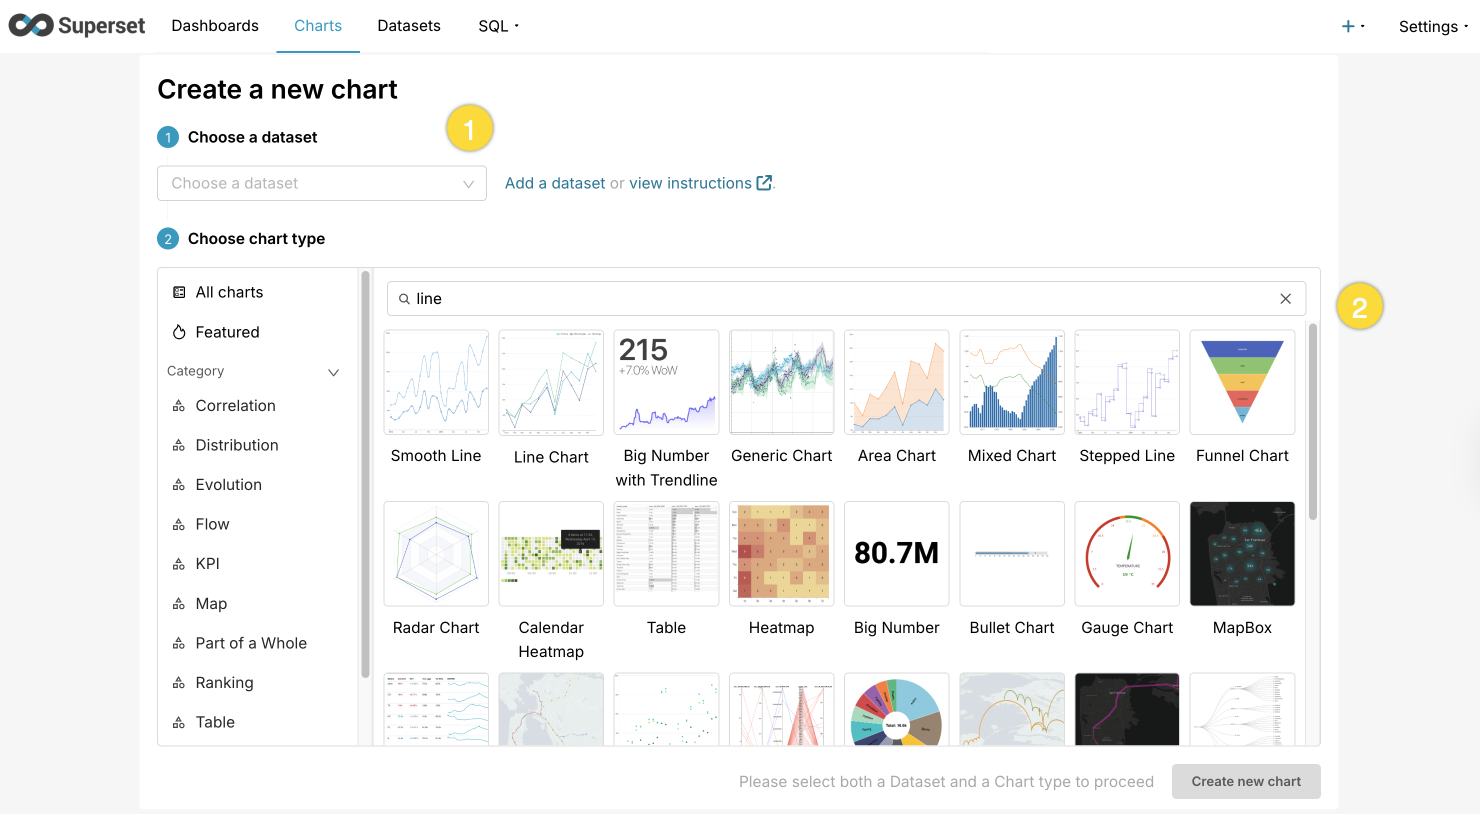
Recommended chart types for drift monitoring:
Chart type Best for Example use case Line chart Drift score over time Visualize how TVD or PSI changes across time buckets Bar chart Comparing drift across columns Side-by-side comparison of drift scores across features Table Detailed drift data Show exact drift scores, sample sizes, and status labels Big Number with Trendline Single-metric overview Display the latest drift score with trend -
Configure the chart:
- Set the Time column to
timestamp(ortime_bucket). - Set the Metric to the drift score column (for example,
drift_score,psi_score,z_score_drift). - Optionally group by
column_nameto plot more than one feature on a single chart.
- Set the Time column to
-
Click Save, and add it to a new or existing dashboard.
Build a monitoring dashboard
To create a centralized view of your model's drift metrics:
-
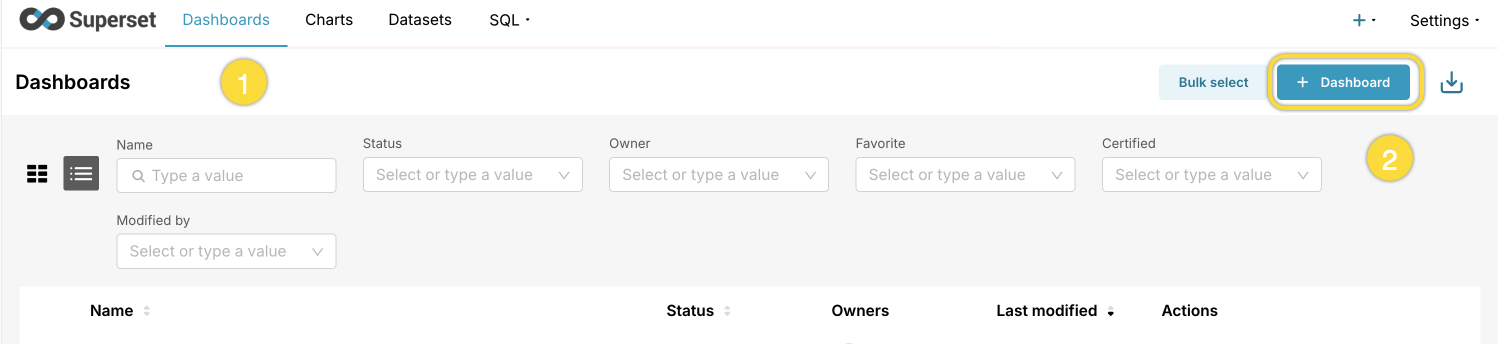
Go to Dashboards and click + Dashboard.
-
Add your drift charts to the dashboard.
-
Arrange charts in a logical layout.
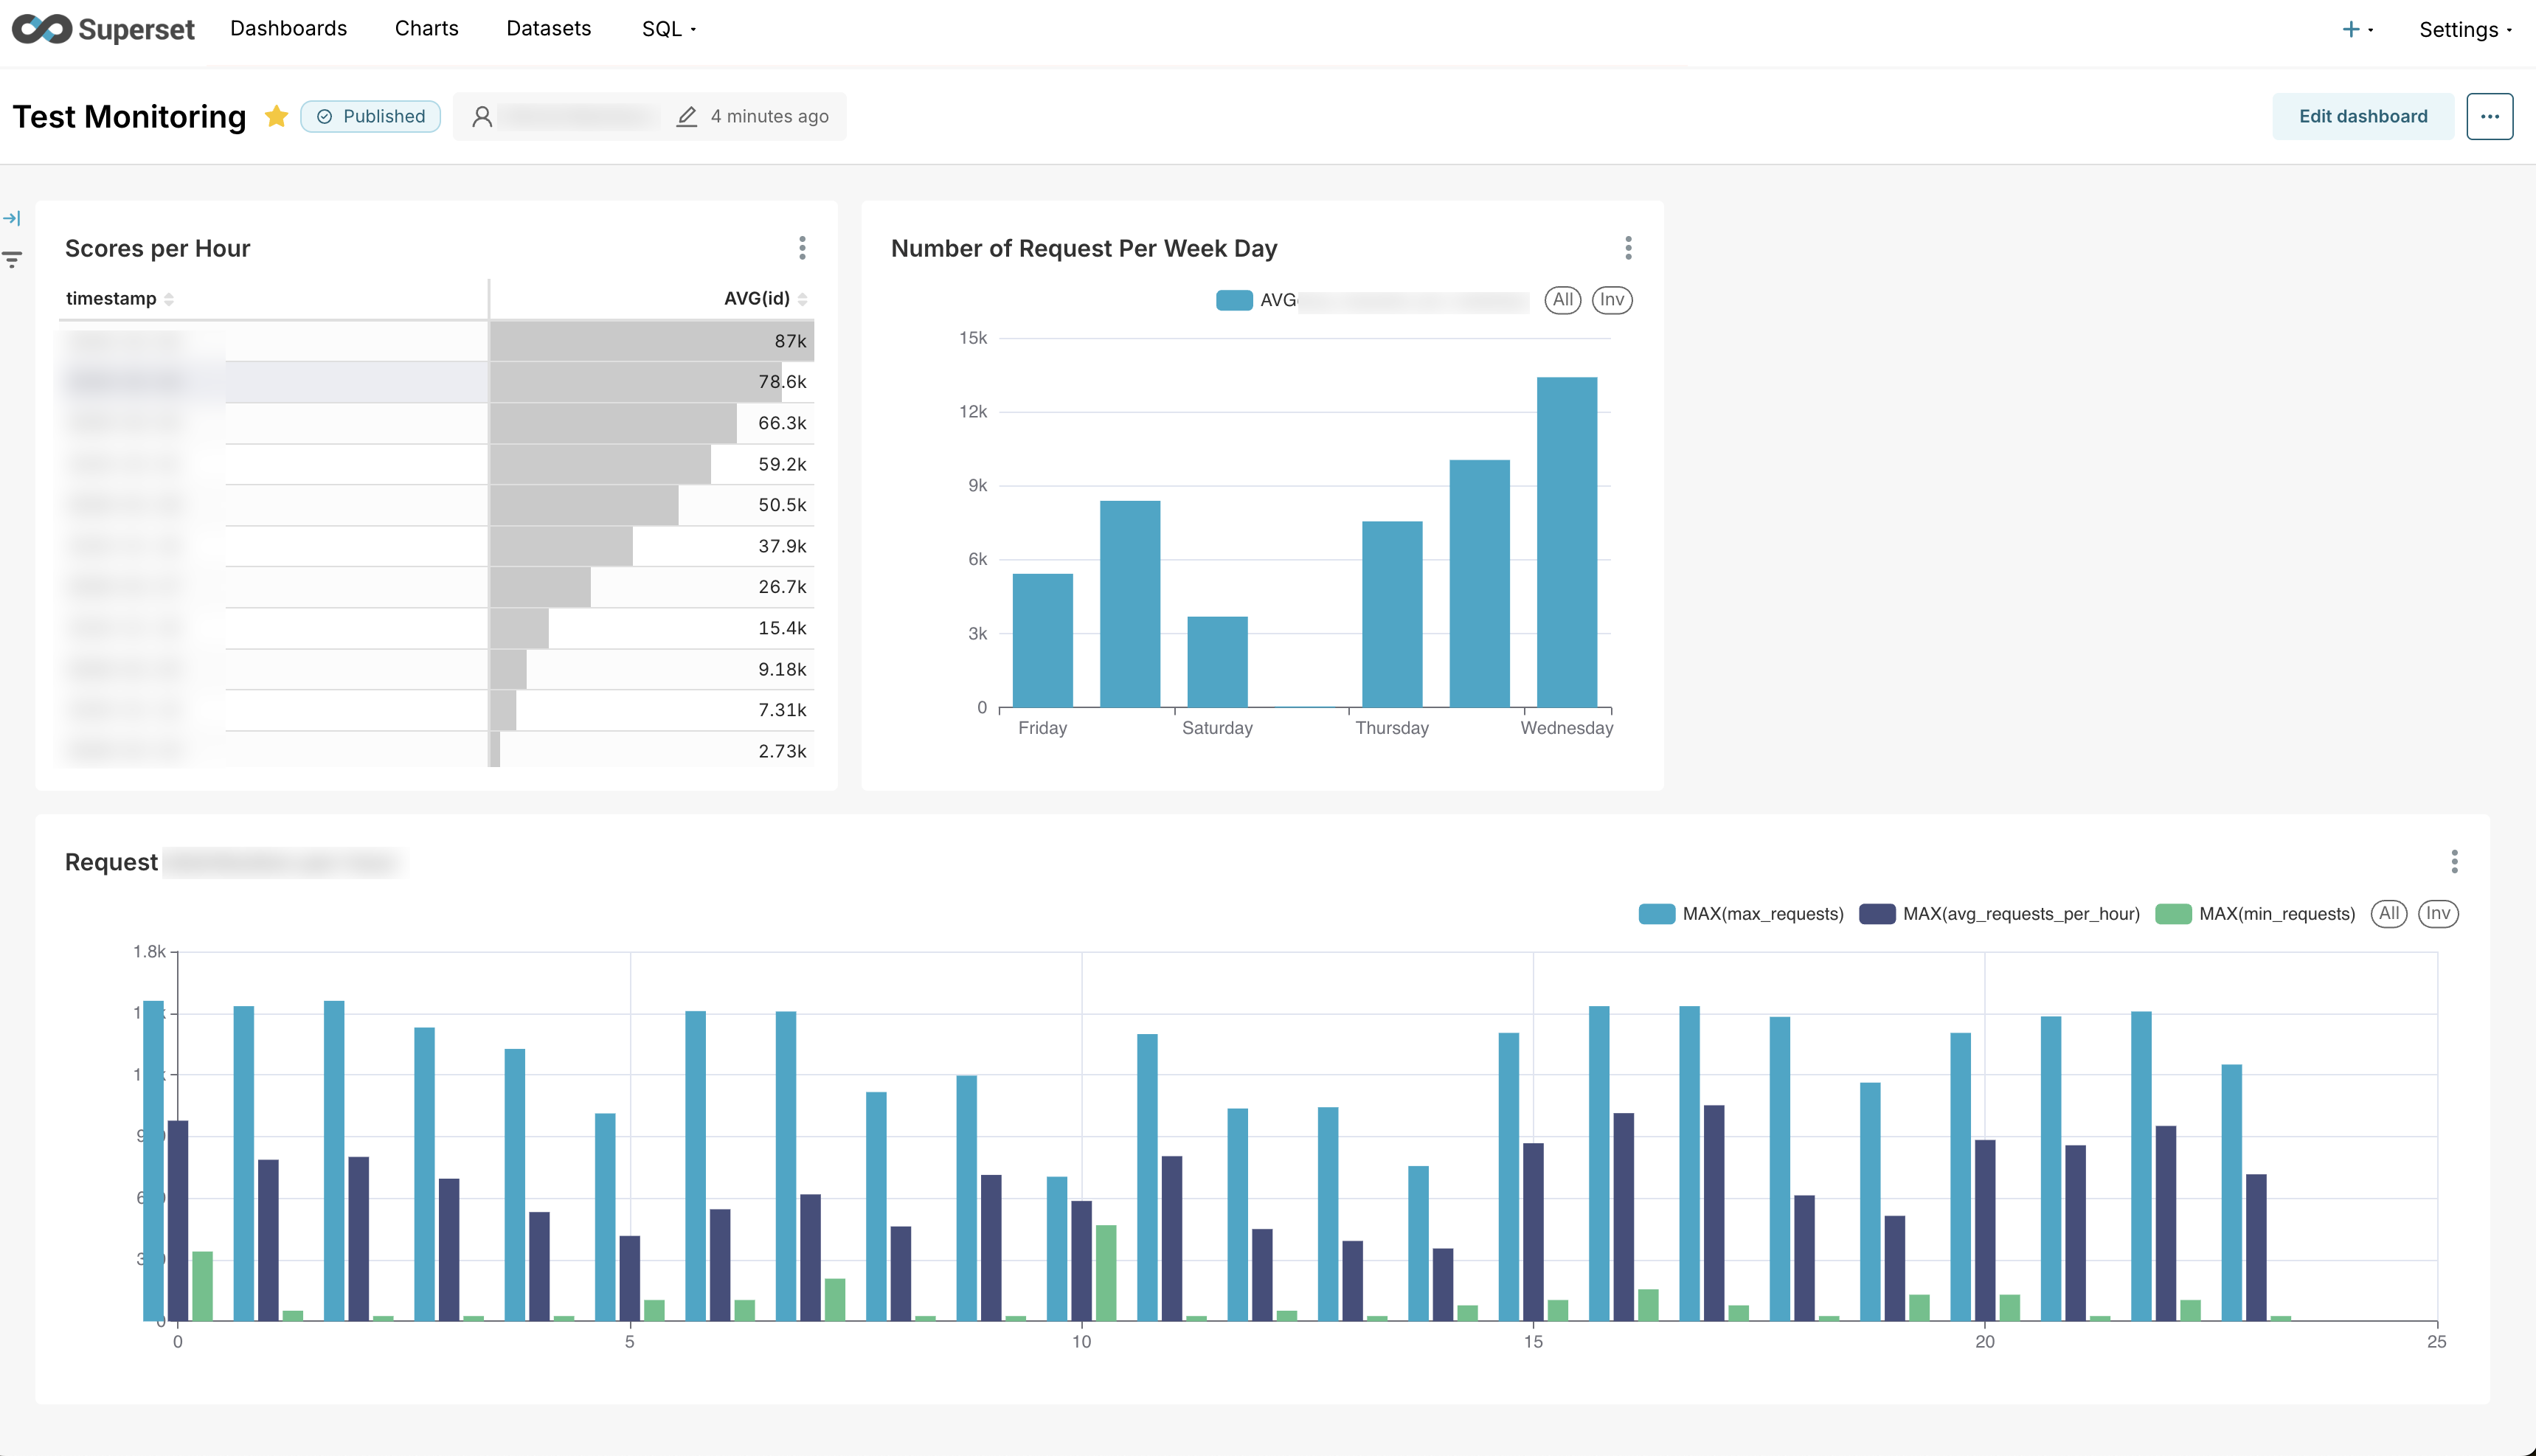
Recommended dashboard layout
| Section | Charts to include |
|---|---|
| Overview | Big Number charts for latest drift scores per key feature |
| Numerical drift | Line charts showing TVD or Z-Score drift over time |
| Categorical drift | Line charts showing PSI drift over time |
| Detail tables | Table charts with exact scores, sample sizes, and drift status |
Dashboard best practices
- Naming: Use descriptive dashboard names that include the model or deployment name (for example,
Credit Model - Drift Monitoring). - Refresh schedule: Set an auto-refresh interval that matches your scoring frequency. For example, if you score hourly, set the dashboard to refresh every hour.
- Filters: Add dashboard-level filters for
column_nameto allow users to focus on specific features. - Annotations: Add annotation layers to mark important events such as model retraining dates or data pipeline changes.
- Sharing: Grant workspace access before sharing a link, or add team members as owners. See Share a dashboard.
Saved dashboards, charts, datasets, and saved queries are visible only to their creator by default. Other non-administrator users don't see your dashboards in their dashboard list, and your charts don't appear in their chart list. To share a dashboard with team members, see Share a dashboard. Administrators can see all objects across the platform.
Share a dashboard
Superset enforces dashboard access at the workspace level, based on the workspace roles assigned in H2O AI Cloud. A user can view a dashboard only if they have access to the workspace that contains the data the dashboard uses. Sending a dashboard link isn't enough on its own—without workspace access, the recipient can't open the dashboard, even with a valid link.
Grant workspace access
Before sharing a dashboard, grant the target user access to the workspace whose data the dashboard uses. You grant this access in H2O AI Cloud, not in Superset.
-
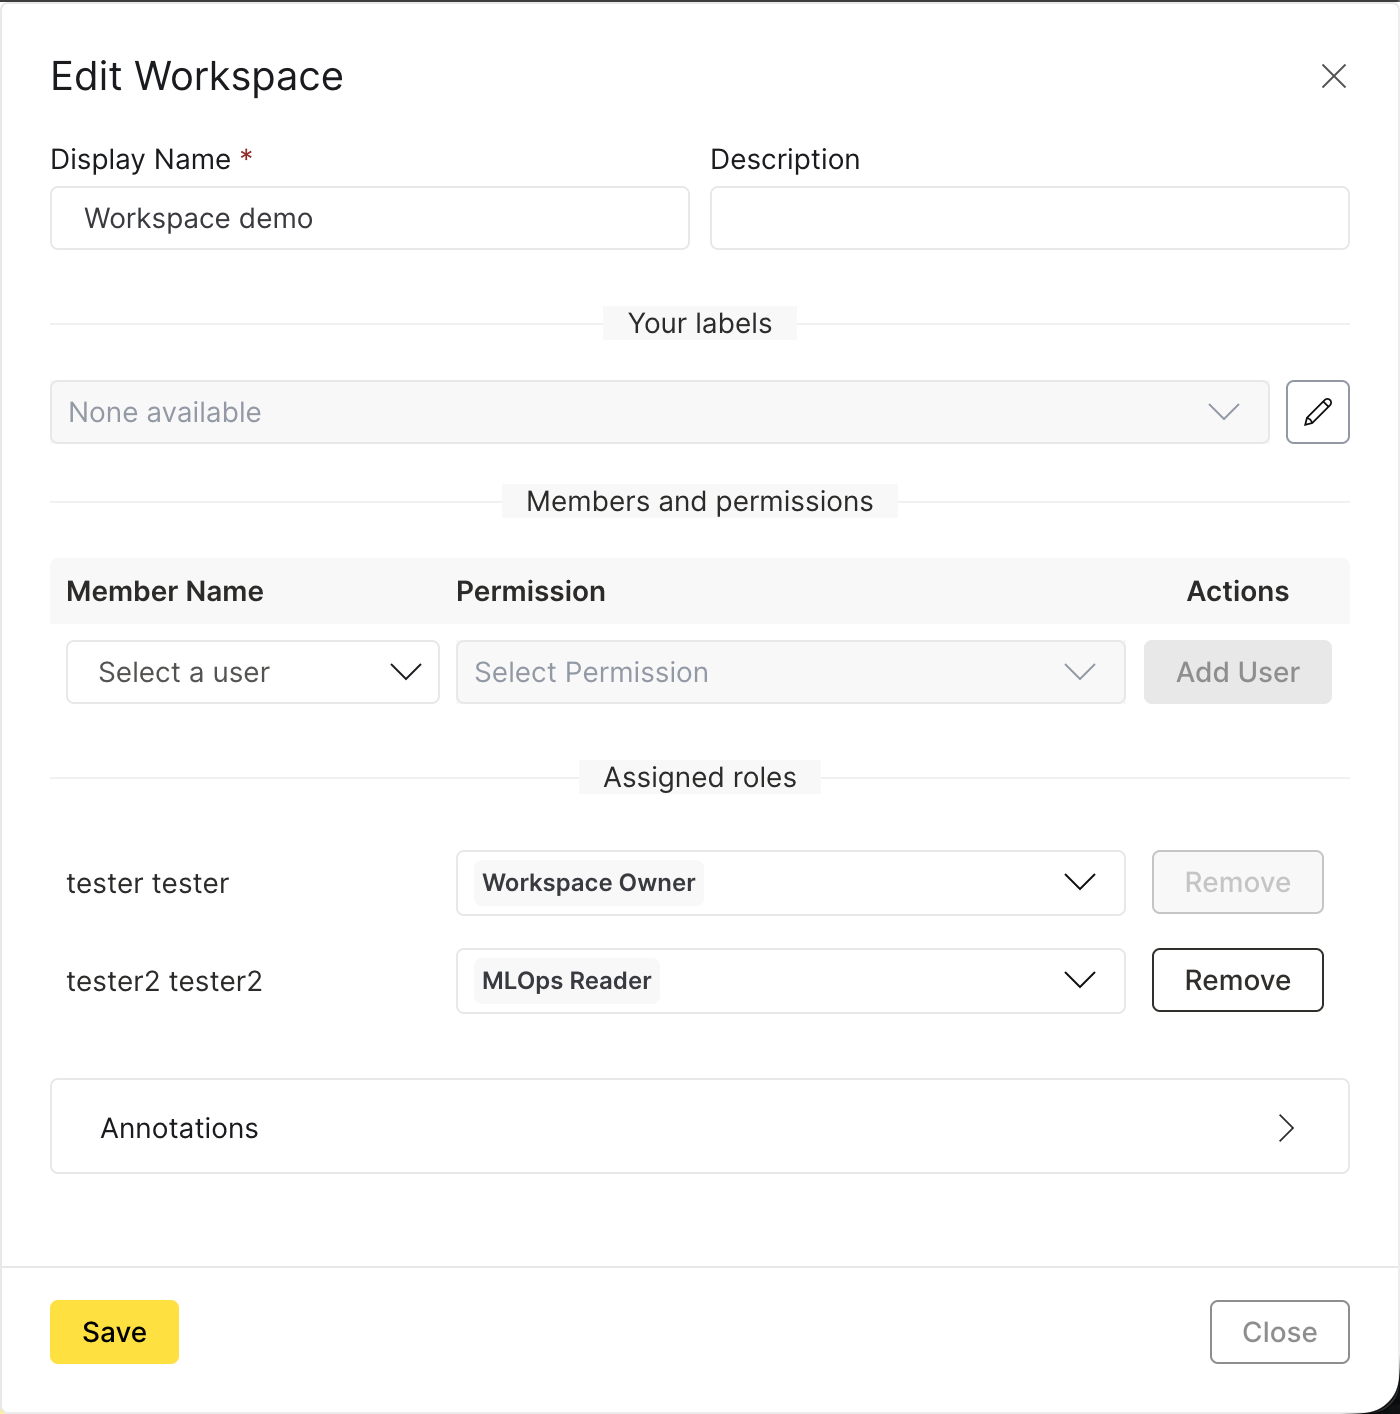
In the H2O AI Cloud App Store, open the workspace and click Edit Workspace.
-
Under Members and permissions, select the user.
-
Assign a permission. The user needs at least the MLOps Reader role to view dashboards backed by that workspace's data. Higher roles, such as Workspace Owner, also grant access.
-
Click Add User.
For more information about managing workspace membership, see Workspaces in H2O AI Cloud.
Share a dashboard link
After a user has workspace access, share a direct link to the dashboard:
-
Open the dashboard.
-
Click the three-dot menu (⋮).
-
Select Share, then choose Copy permalink to clipboard or Share permalink by email.
-
Send the link to the user.

Add a user as a dashboard owner
Add a user as an owner so the dashboard appears in their dashboard list and they can edit it:
-
Open the dashboard and click Edit dashboard.
-
Click the three-dot menu (⋮) and select Edit properties.
-
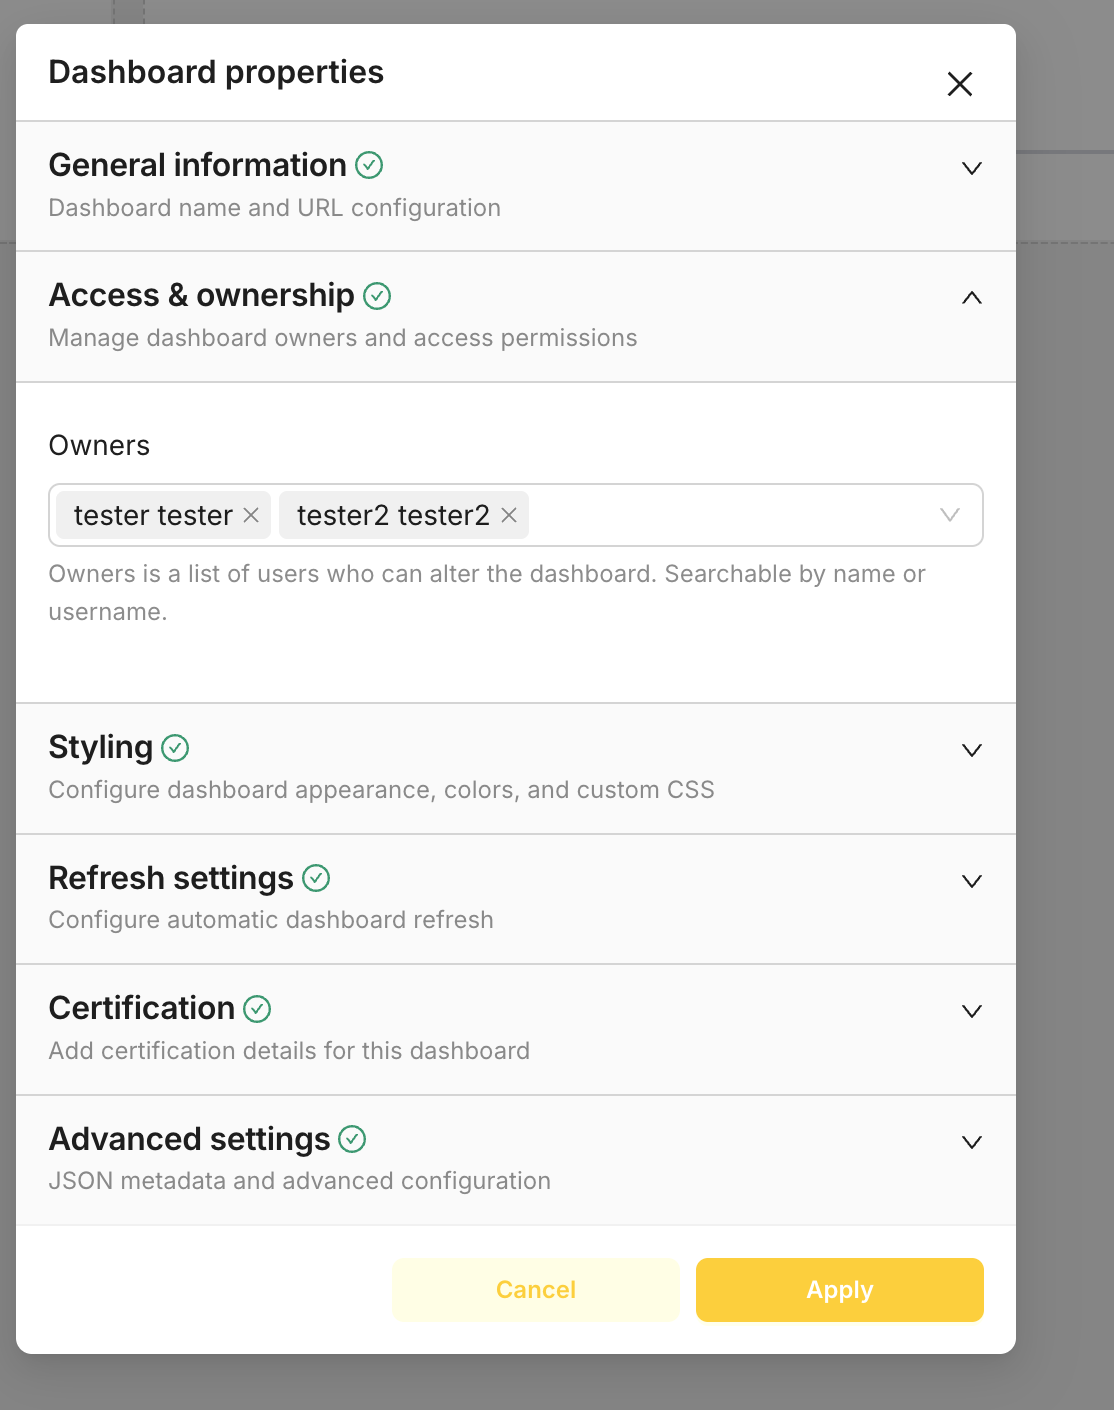
Expand Access & ownership.
-
Under Owners, search for the user by name or username and add them.
-
Click Apply.
Data export
An administrator can turn data export on or off in Superset by changing the relevant values in the Helm chart or by editing the user's role.
Next steps
- Set up alerts that notify you when drift exceeds thresholds
- Export raw scoring data to Kafka for custom processing
- Submit and view feedback for this page
- Send feedback about H2O MLOps to cloud-feedback@h2o.ai