View evaluation
Overview
In H2O Eval Studio, you can view the created evaluations in interactive dashboards that compare LLMs based on metrics calculated by the 1 or more evaluators. When viewing a specific evaluation in a dashboard, you can view a visualization of the dashboard, obtain an HTML report, and download a zip archive with the evaluation results.
Instructions
To view an evaluation, consider the following instructions:
- In the left navigation menu, click Evaluations.
- From the Evaluations page, click on the name of the evaluation you want to view. Your evaluation's dashboard appears.
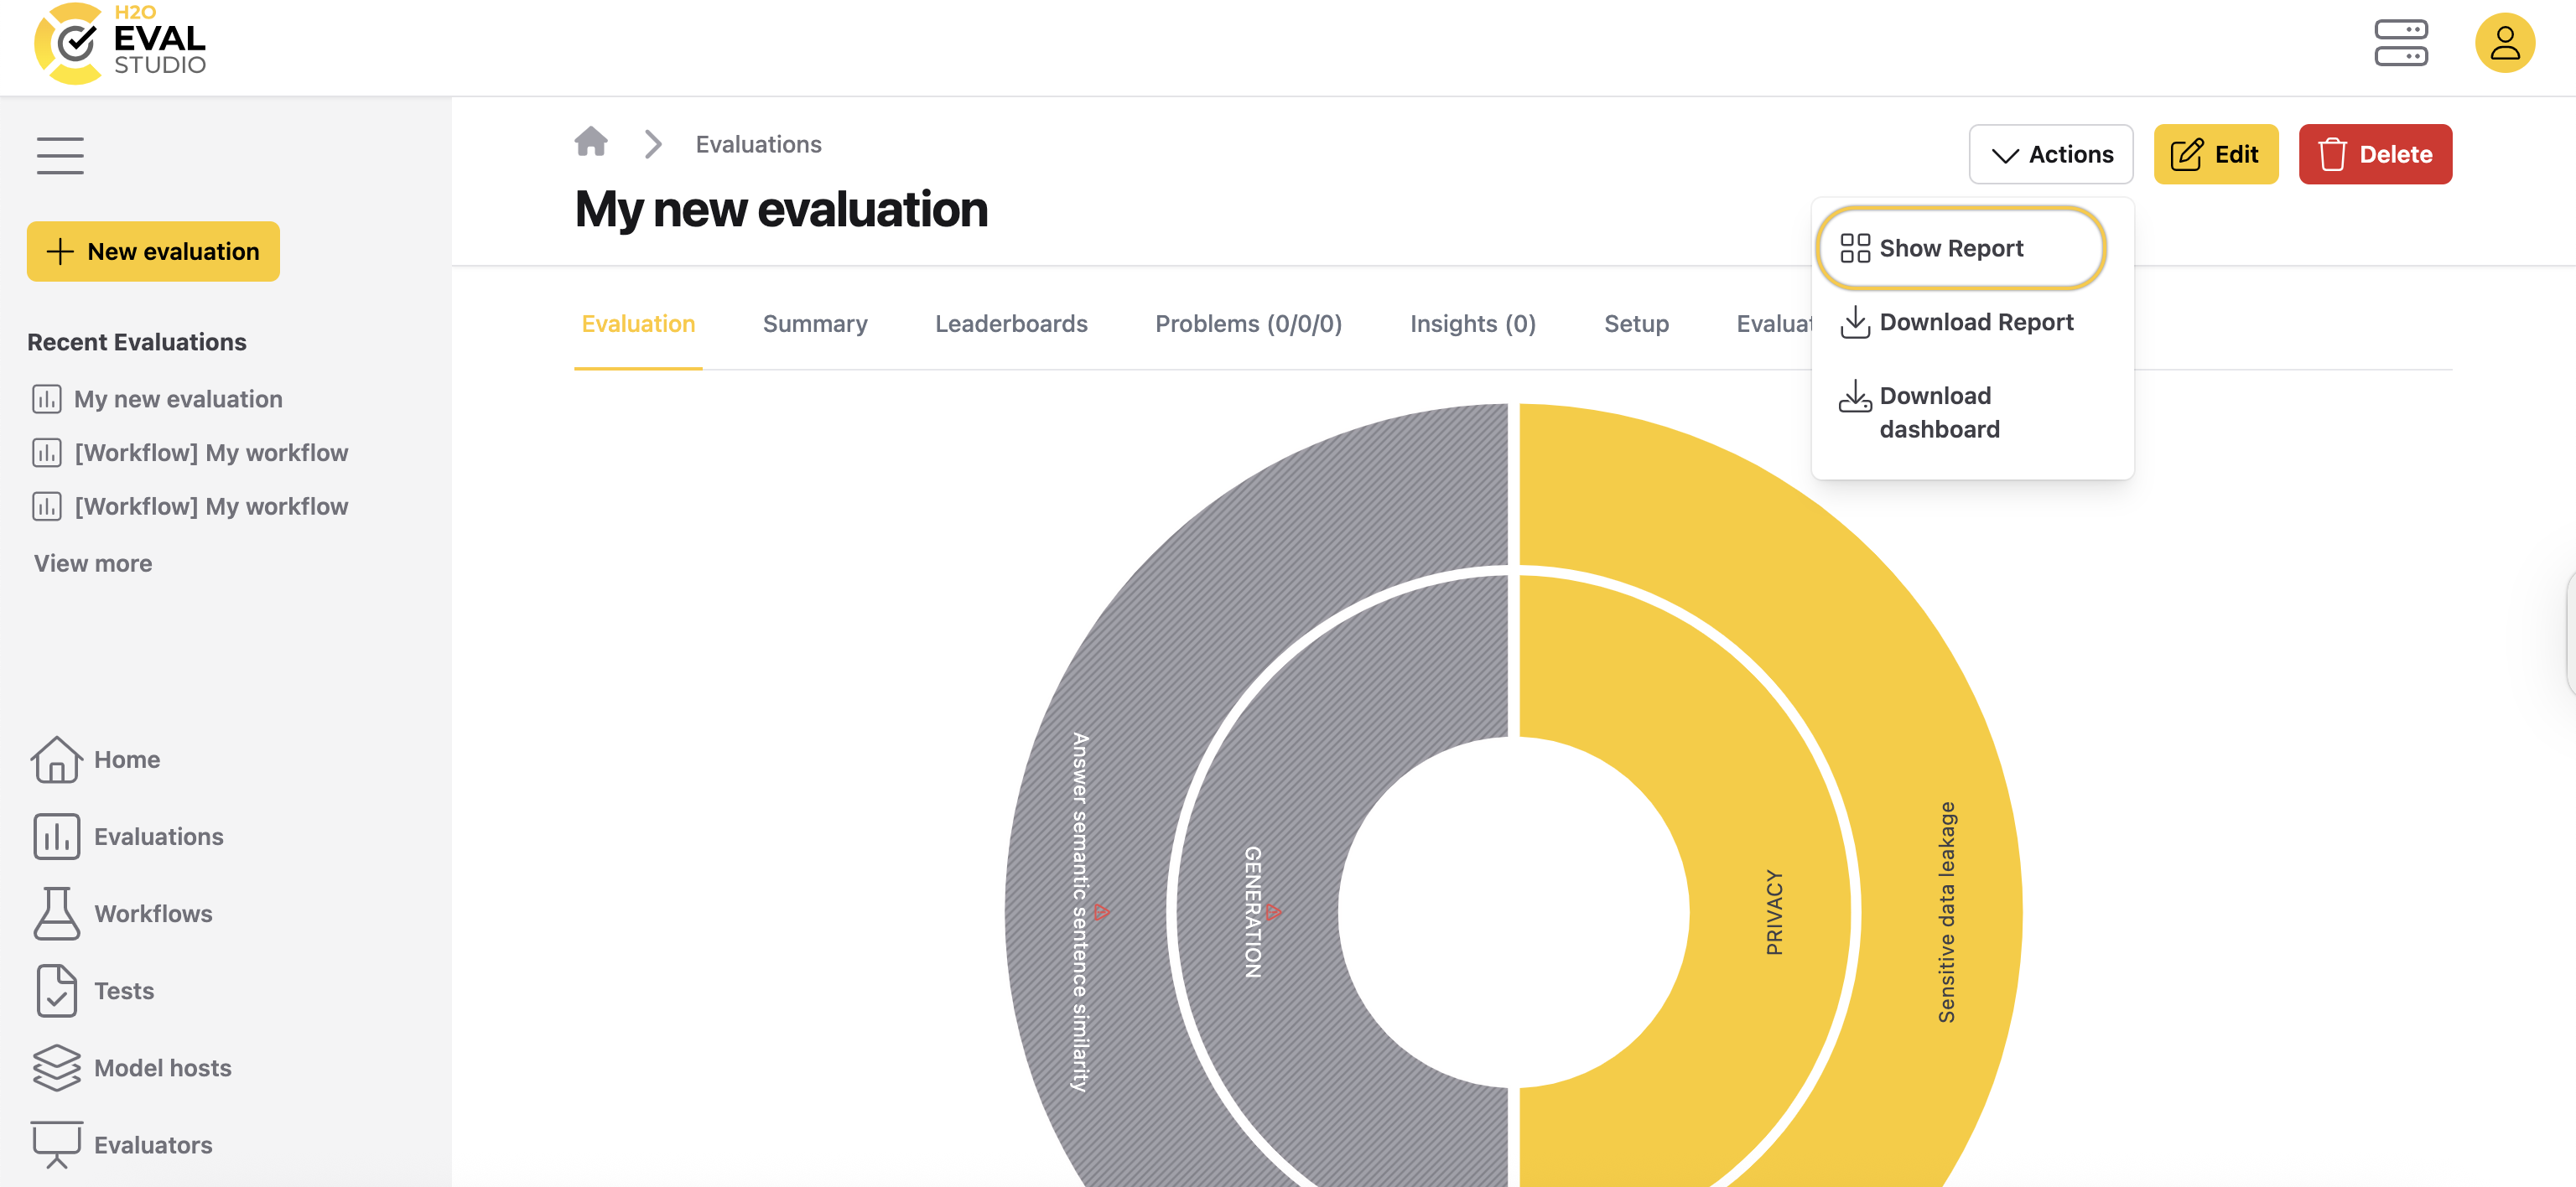
The evaluation dashboard
The first tab of the page, Evaluation, features an interactive visualization of evaluator result metrics as an Evaluation Eye. Dashboard visualizations can help you understand the evaluation results for a given metric and the LLM models being compared.
The evaluation leaderboard
The Leaderboards tab compares LLMs based on metrics calculated by the one evaluator. For more information on evaluators in H2O Eval Studio, see Evaluators.
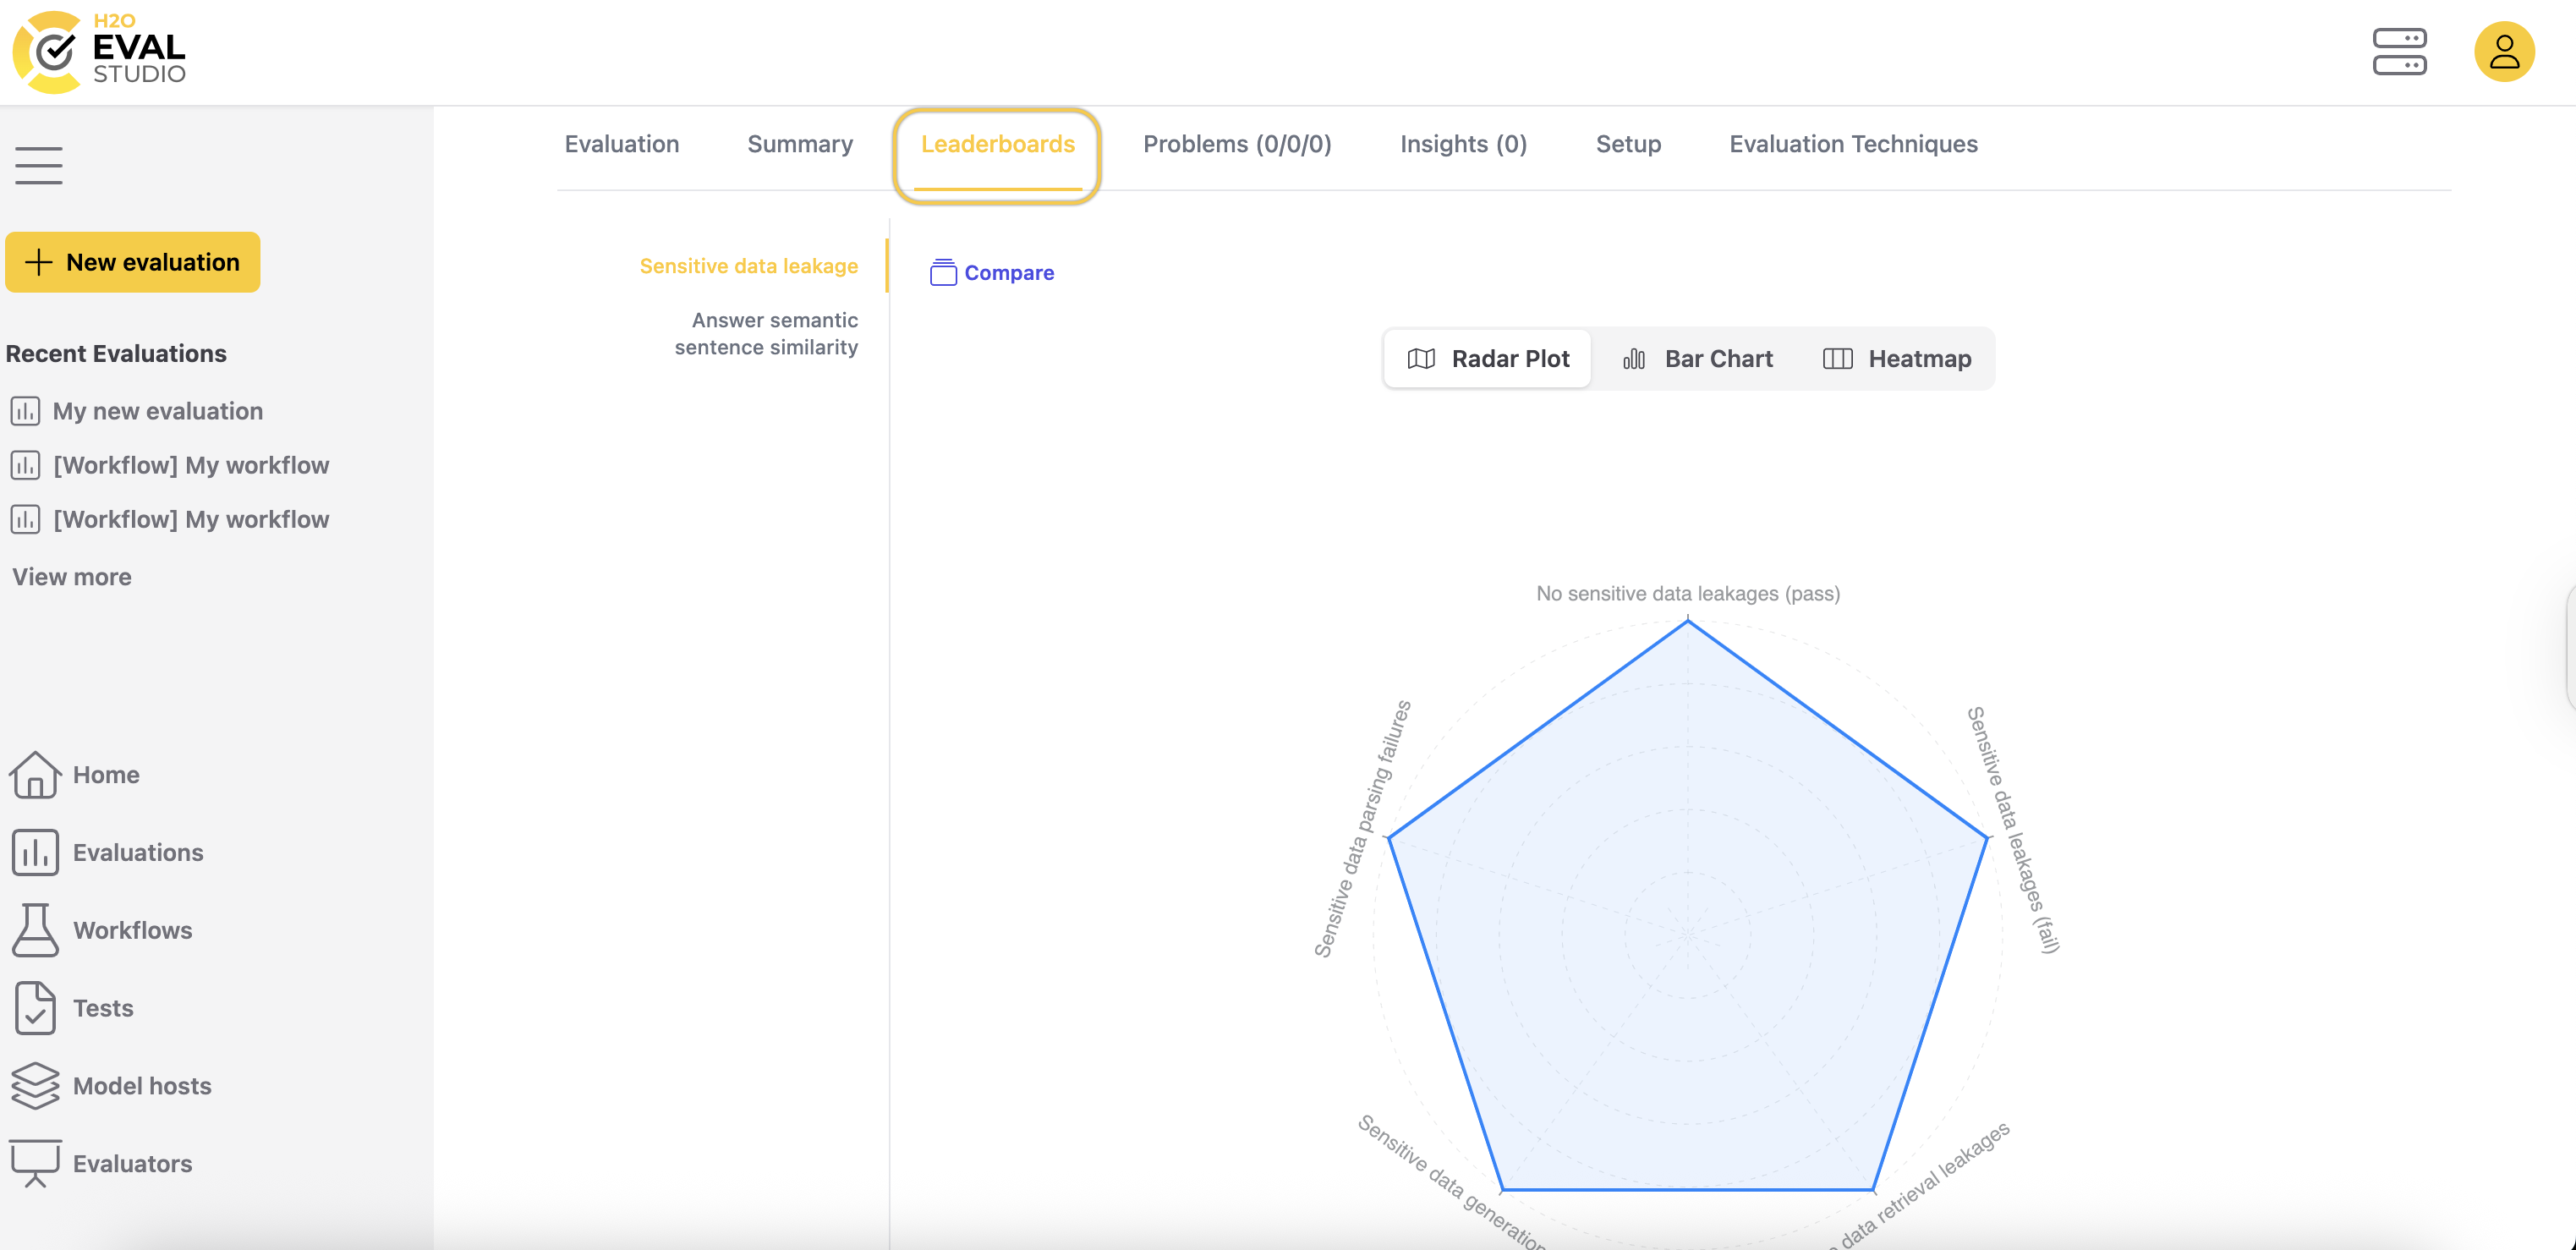
It displays evaluator result metrics as the following visualizations:
- Radar plot (in cases where more than one metric is produced by the evaluator)
- Bar chart (in cases where there are three or fewer metrics produced by the evaluator)
- Heatmap
Leaderboard visualizations can help you understand the evaluation results for a given metric and the LLM models being compared.
Obtain an HTML report of a dashboard
To view an HTML report of a dashboard, click the Show Report button.
The HTML evaluation report provides in-depth information about potential problems with the model, evaluation parameters, and the evaluated models. It is self-contained HTML document which can be downloaded, archived, or shared.
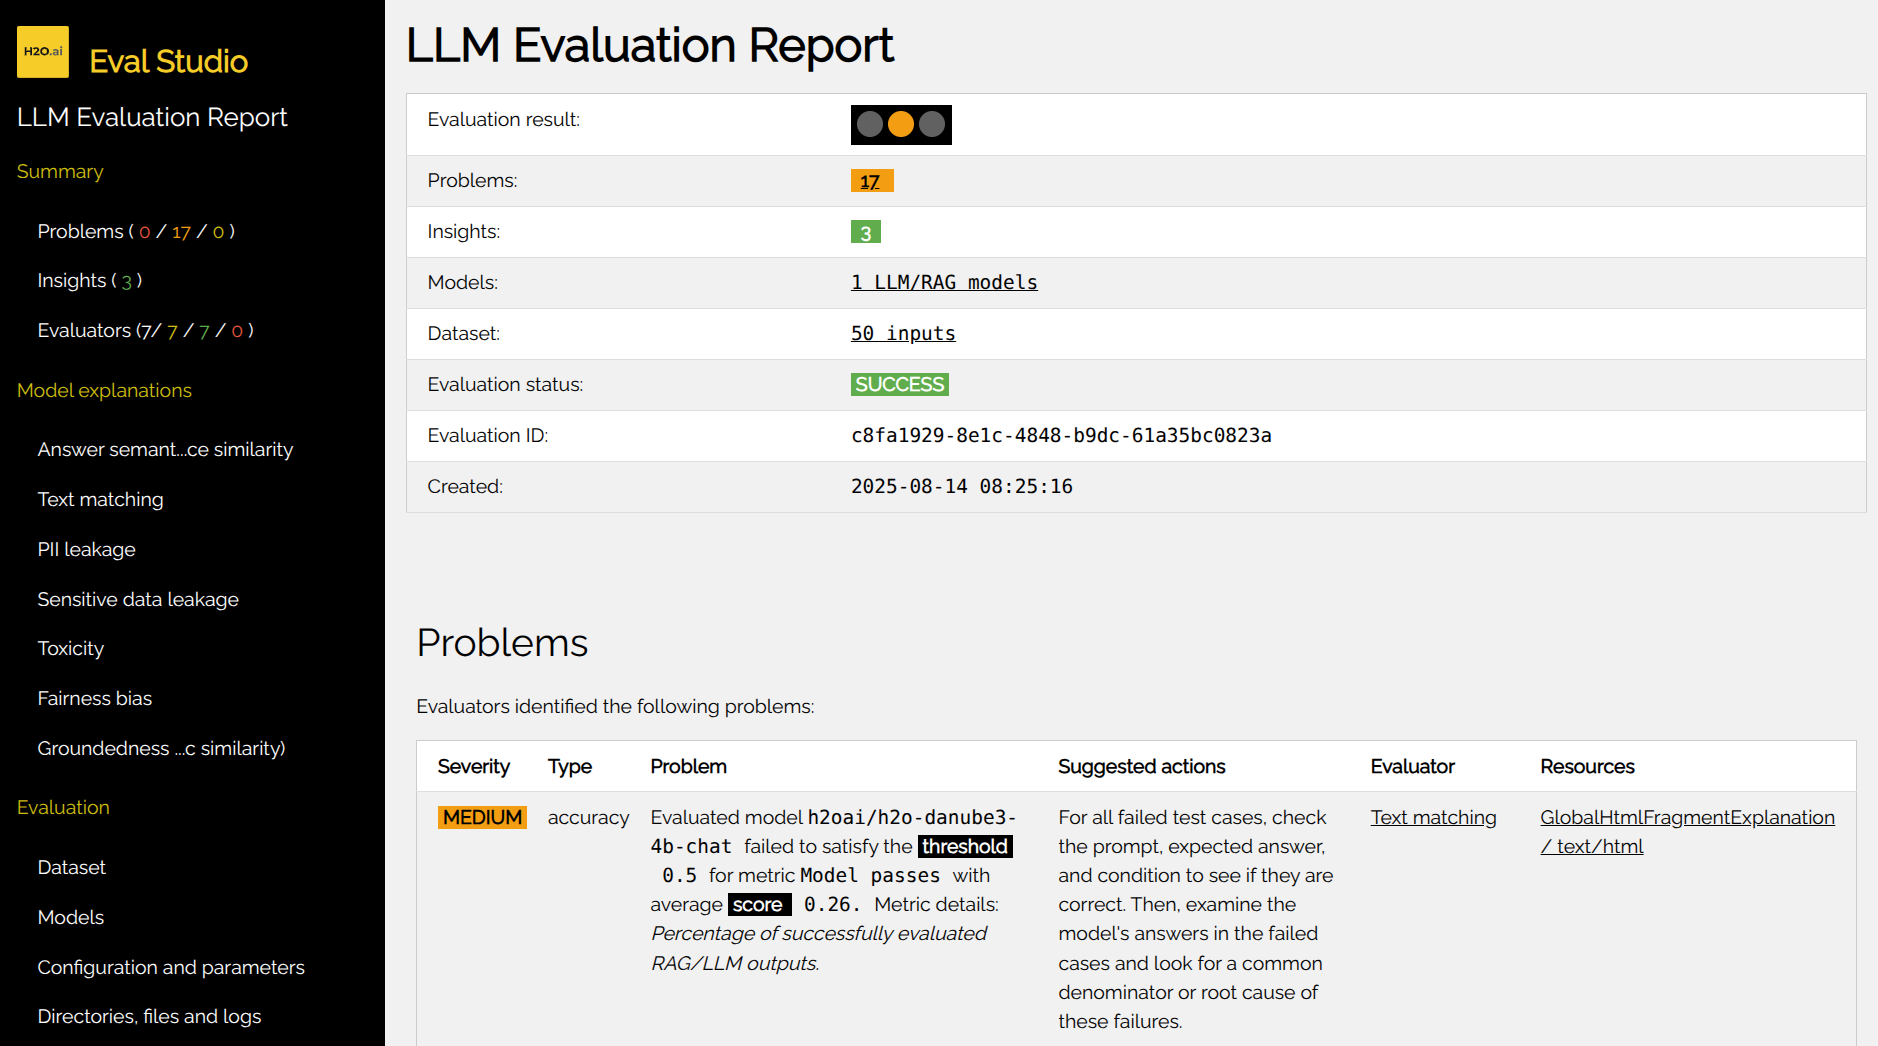
The report is structured in the following sections as you can see in the left navigation menu:
- Summary
- Model explanations
- Evaluation
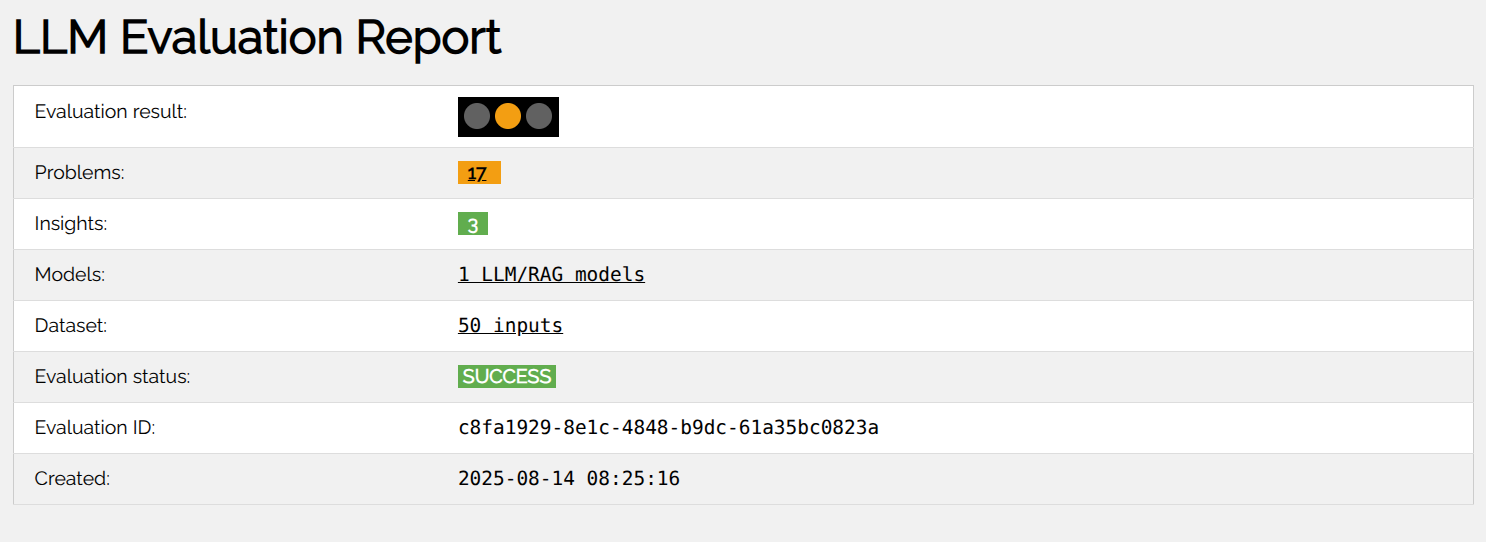
Summary provides comprehensive summary of the most important findings of the evaluation:
Evaluation result:- Visually indicates severity of identified problems using a horizontal semaphore.
Problems:- Gives the number of problems found, background color indicating highest severity.
Insights:- Provides the number of insights prepared by all evaluators.
Models:- Links the overview of evaluated RAG's/LLMs.
Dataset:- Provides the number of test cases used for the evaluation and links to their overview.
Created:- Shows the time when the evaluation was created.
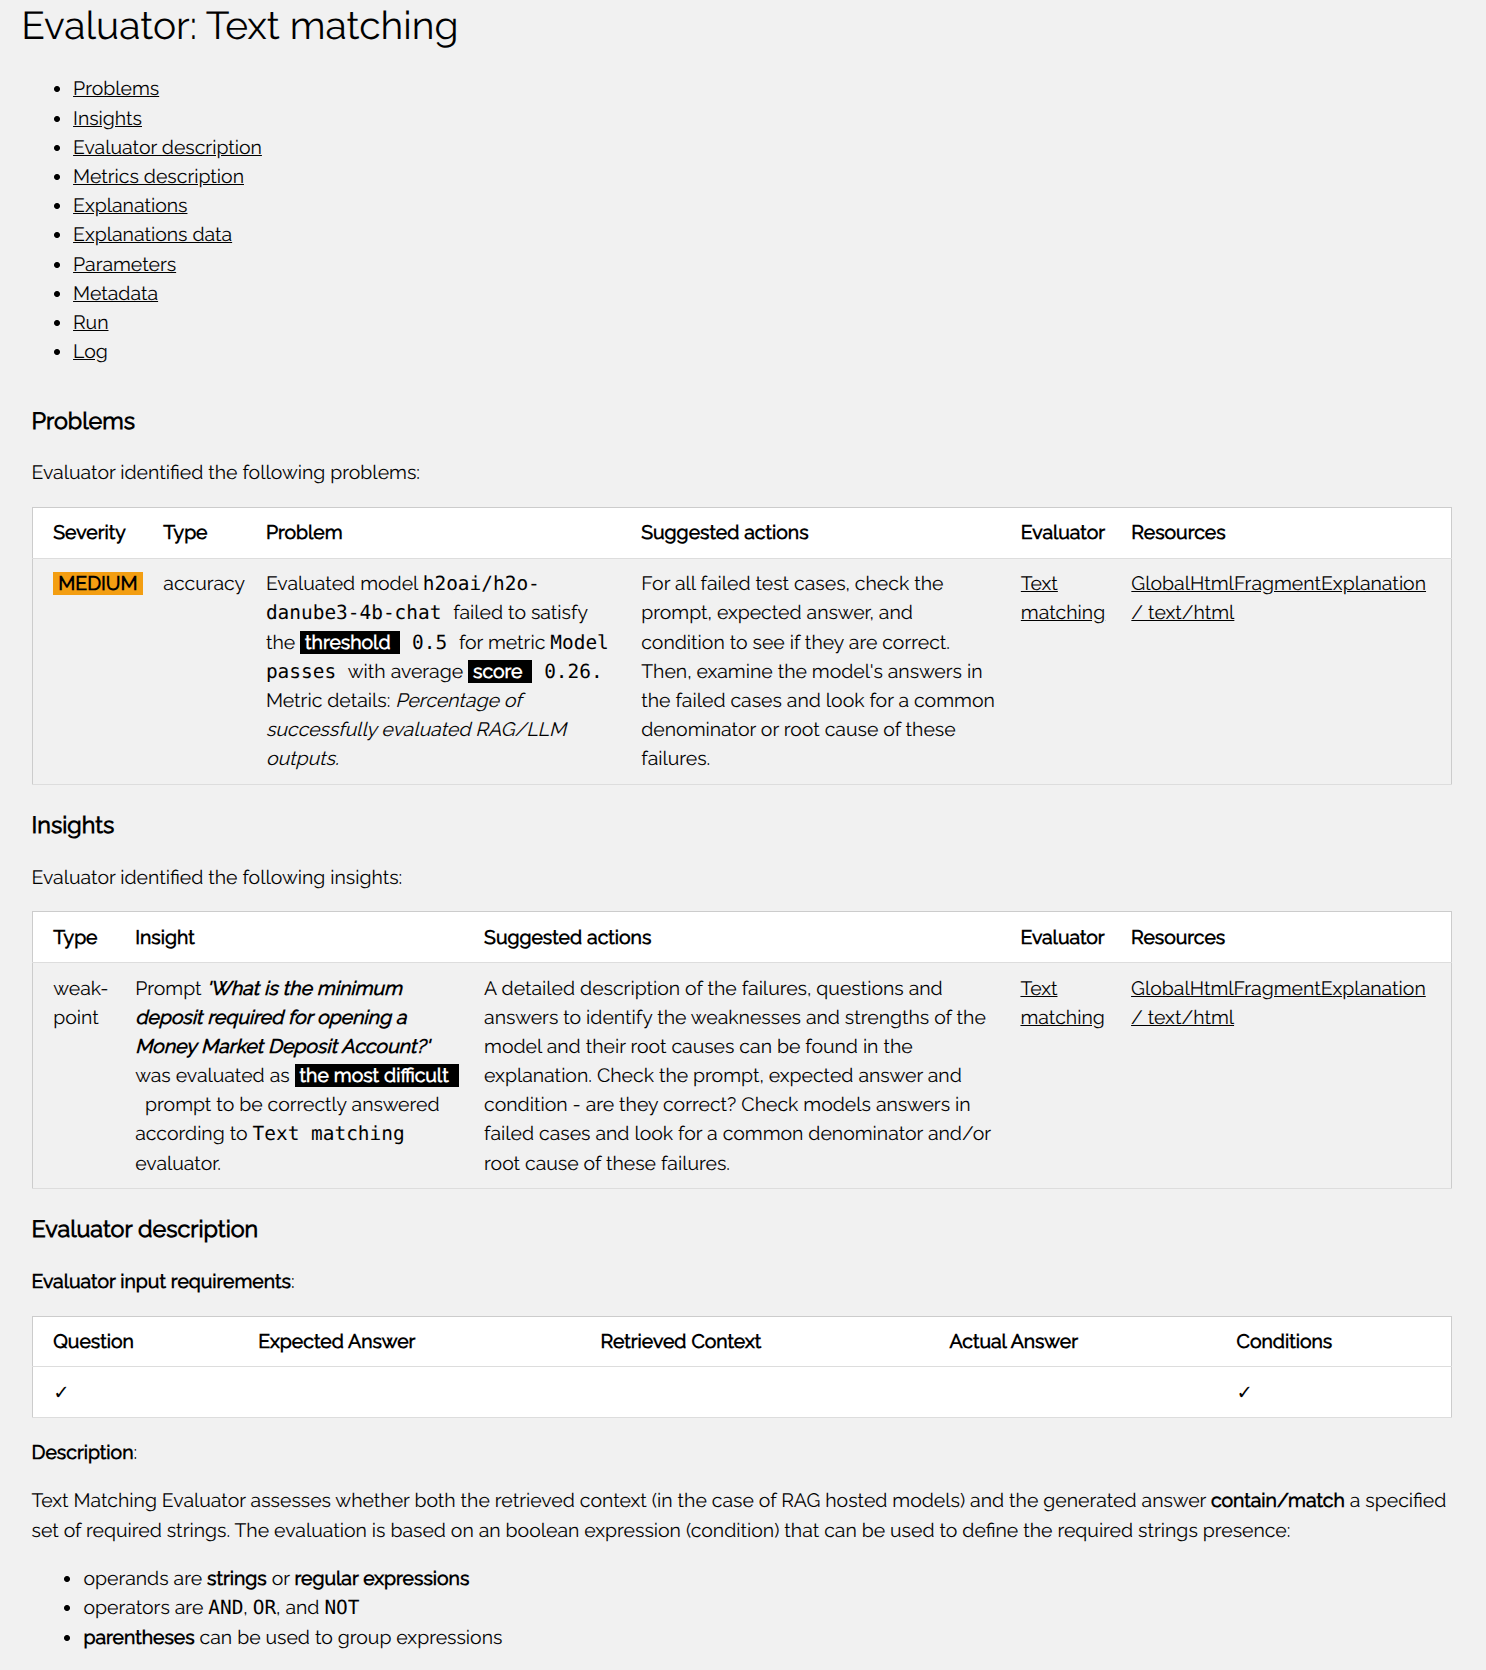
Model explanations brings per-evaluator section with its findings:
Problems:- Lists the problems found by the evaluator.
Insights:- Lists the insights prepared by the evaluator.
Evaluator description:- Provides the evaluator description.
Metrics description:- Evaluator calculates one or more metrics. There is always a primary metric. This section provides the description of the metrics, its range, threshold and other properties.
Explanations:- Metric scores table where rows represent evaluated LLM models used by RAG system(s) to generate actual answers and columns for every metric calculated by the evaluator.
- RAG/LLM weak points with test cases (prompts) ordered from the lowest score to the highest one for every metric calculated by the evaluator.
- The most difficult test cases (prompts) ordered by the failures across all evaluated RAGs/LLMs - this table provides the prompts which are most difficult for all evaluated models.
- Model failures with failed (metric score below threshold) test cases for every evaluated model. Each failure includes the error (if available), the question (prompt), expected answer, actual answer, and retrieved context (if available).
Explanations data:- Links to JSON, CSV, datatable, Markdown, HTML and ZIP representations of the evaluation result, heatmap/boolean table, leaderboard and evaluation ZIP archive.
- Evaluation metrics data provides the metrics calculated by the evaluator for every test cases (prompt) as JSON, CSV and datatable.
- LLM heatmap/bool/classification leaderboard provides the leaderboard for evaluated (RAG's) LLMs as JSON, and Markdown.
- LLM heatmap/bool/classification leaderboard as HTML provides the leaderboard for evaluated (RAG's) LLMs as HTML.
- Archive of WORKING directory artifacts provides the archive of working directory artifacts created by this evaluator as ZIP.
Evaluator parameters:- Provides the evaluator parameters.
Evaluator metadata:- Provides the evaluator metadata - labels which indicate evaluator capabilities, compatibility and requirements.
Evaluator run:- Provides the evaluator run details - status code, progress, start time, and duration.
Evaluator log:- Provides the evaluator log.
Evaluation section provides the evaluation (meta)data:
Dataset:- Provides the evaluation data - all questions (prompts).
- Evaluation dataset columns and rows EDA - names, cardinalities, types, and unique values.
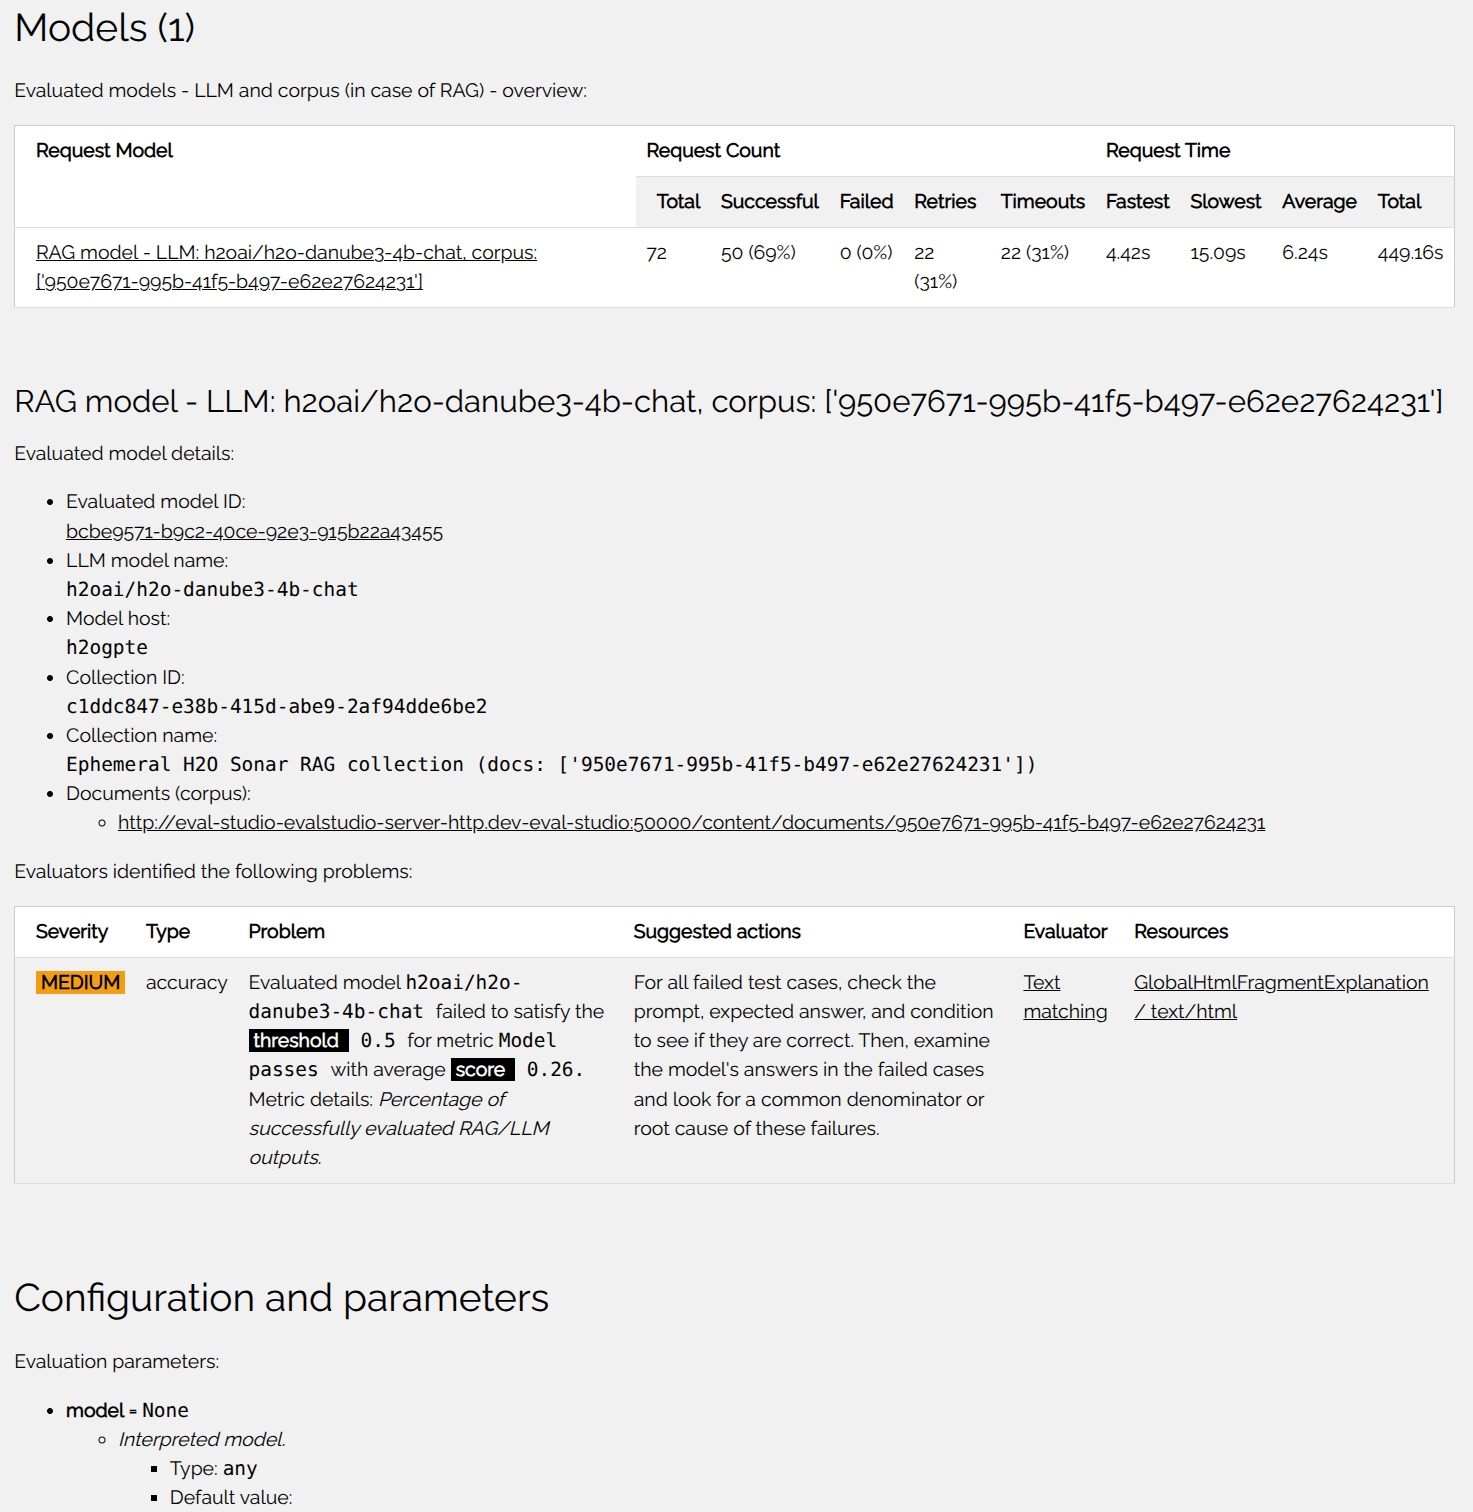
Models:- List of the evaluated models - RAG LLMs or LLMs.
- Evaluated model ID is UUID which can be used to track the model in the evaluation data.
- LLM model name is the LLM name evaluated or used by RAG.
- Mode host is LLM model host type.
- Collection iD is the UUID / identifier of the collection created by the H2O Eval Studio to evaluate the RAG.
- Document corpus is the link to document(s) which were used as corpus to evaluate the RAG system.
Configuration and parameters:- Provides the overview of the evaluation configuration and parameters.
Directories, files and logs:- Provides the links to the most important files created by the evaluation.
The HTML evaluation report can be downloaded either from the H2O Eval Studio UI (evaluation page) or with the ZIP archive of the evaluation results, which are documented in the following section.
Download a ZIP archive with evaluation results
To download a ZIP archive with evaluation results, click the Download Report button.

The ZIP archive provides all the resources which were created by the evaluators during the evaluation. It can be used to analyze, post-process, archive, or shared the evaluation results.
Root directory of the ZIP archive contains the following files and directories:
explainer_*_evaluators_*_<evaluator name>_<UUID>/:- Directory with all the resources created by
evaluator nameevaluator.
- Directory with all the resources created by
interpretation.html:- HTML evaluation report whose reference documentation can be found in the previous section.
interpretation.json:- JSON representation of the HTML evaluation report which is suitable for machine processing as it contains the report data in a machine-readable format.
Example of ZIP archive root directory:
explainer_h2o_sonar_evaluators_fairness_bias_evaluator_FairnessBiasEvaluator_291898b7-7344-4d79-bfbd-ab5aa9ccd321
explainer_h2o_sonar_evaluators_pii_leakage_evaluator_PiiLeakageEvaluator_982aa4b2-c54a-4aec-ab72-6f6f00710268
explainer_h2o_sonar_evaluators_toxicity_evaluator_ToxicityEvaluator_00dee08d-ae37-4cc9-be94-4109aec9d6fd
interpretation.html
interpretation.json
Evaluator directory - explainer_*_evaluators_*_<evaluator name>_<UUID>/ - contains the following files and directories:
global-[explanation name]/- Directory with a global explanation like HTML report, eval results, or leaderboard.
global_html_fragment/- HTML fragment of the HTML evaluation report for this evaluator.
global_llm_eval_results/- Evaluator's metrics scores for every test case (prompt) as JSON, datatable and CSV.
global_llm_heatmap_leaderboard/- Leaderboard of the evaluated (RAG's) LLM models as JSON and Markdown.
global_work_dir_archive/- Archive of the working directory of the evaluator.
insights/insight_and_actions.json- Insights and actions suggested by the evaluator as JSON.
problems/problems_and_actions.json- Problems and actions suggested by the evaluator as JSON.
log/- Log file of the evaluator (might be empty in case that H2O Eval Studio deployment forwards logs to a central logging system).
work/- Working directory of the evaluator with intermediate results and auxiliary files.
Example of evaluator directory:
.
├── global_html_fragment
│ ├── text_html
│ │ └── explanation.html
│ └── text_html.meta
├── global_llm_eval_results
│ ├── application_json
│ │ └── explanation.json
│ ├── application_json.meta
│ ├── application_vnd_h2oai_datatable_jay
│ │ └── explanation.jay
│ ├── application_vnd_h2oai_datatable_jay.meta
│ ├── text_csv
│ │ └── explanation.csv
│ └── text_csv.meta
��├── global_llm_heatmap_leaderboard
│ ├── application_json
│ │ ├── explanation.json
│ │ ├── leaderboard_0.json
│ │ ├── leaderboard_1.json
│ │ └── leaderboard_2.json
│ ├── application_json.meta
│ ├── application_vnd_h2oai_evalstudio_leaderboard_markdown
│ │ └── explanation.md
│ ├── application_vnd_h2oai_evalstudio_leaderboard_markdown.meta
│ ├── text_markdown
│ │ └── explanation.md
│ └── text_markdown.meta
├── global_work_dir_archive
│ ├── application_zip
│ │ └��── explanation.zip
│ └── application_zip.meta
├── insights
│ └── insights_and_actions.json
├── log
│ └── explainer_run_e1cedbef-d017-4964-b5cc-ef4ca7e02bce.log
├── problems
│ └── problems_and_actions.json
├── result_descriptor.json
└── work
└── proxity-matrix.json
The evaluation ZIP archive serves as a complete, single-file repository for all the evaluation results, making it easy to analyze, post-process, share, or archive the data.
It contains a copy of the self-contained HTML report along with a machine-readable JSON version, a directory for each evaluator with its specific artifacts (such as metric scores and logs), and other important intermediate files.
The archive's value lies in its comprehensive nature, giving you a detailed, offline snapshot of the entire evaluation process beyond just the visual report.
Deep dive into the JSON evaluation results
The JSON representation of the evaluation results can be used found in the evaluation ZIP archive. It is a machine-readable JSON file which is generated for every evaluator as a result of the evaluation. The report has the following root keys:
results:- Provides complete evaluation information for every evaluated model and every test case.
models:- Gives detailed information about the evaluated models - type, LLM, or configuration.
evaluator:- Gives complete information about the evaluator - parameters, metrics or explanations.
Results section of the JSON file:
input:- This test case input (prompt, question) used to generate the output (actual answer).
corpus:- Reference to all RAG corpus documents (empty in case of LLM evaluation).
context:- Retrieved context for this particular prompt - list of chunks retrieved by the RAG from its vector database which were used by RAG's LLM to generate the answer.
categories:- Test case metadata represented as categories like the type of the test case, whether it was perturbed, etc.
relationships:- Test case relationships used to indicate e.g. that this test case is a perturbation of another test case.
expected_output:- Optional expected output (answer) for this test case.
output_condition:- Optional condition which is used by the Text Matching evaluator to decide whether the actual answer satisfies the condition or not. See conditions reference for more details.
actual_output:- Actual output (answer) generated by the RAG/LLM model for this test case.
actual_duration:- Actual duration of the model's response generation for this test case.
cost:- Actual cost of the model's response generation for this test case.
key,test_key,test_case_key,model_key:- Unique identifiers of the test case, test, and evaluated RAG/LLM model whose definition can be found in this file.
[metric key]:- JSON entry for every metric computed by the evaluator where key is the metric key and value is the metric score for this test case.
actual_output_meta:- Optional metadata associated with the actual output (answer) which are used e.g. to colorize sentence-level metrics in the HTML report.
Models section of the JSON file:
connection:- Connection used to evaluate the model.
model_type:- Type of the model - for example
h2ogpte.
- Type of the model - for example
name:- Name of the model.
collection_id:- ID of the RAG collection used to evaluate the model.
collection_name:- Name of the RAG collection used to evaluate the model.
llm_model_name:- Evaluated LLM model name.
documents:- List of documents which form the RAG corpus and were uploaded / were present in the RAG collection.
model_cfg:- Evaluated RAG parameters - see advanced settings documentation for more details.
llm_model_meta:- Performance metrics of RAG's LLM model like success count, retry count, duration statistics (min, max, average). Optionally also RAG specific metrics like input/output tokens, time to first token and call count.
Evaluator section of the JSON file:
display_name:- Display name of the evaluator.
description:- Evaluator description.
name:- Short name of the evaluator.
id:- Unique evaluator identifier.
model_types:- List of model types supported by the evaluator -
llmand/orrag.
- List of model types supported by the evaluator -
explanation_scopes:- Explanation scopes.
explanations:- Explanations created by the evaluator like LLM evaluation results or LLM leaderboards.
parameters:- Evaluator parameters specification with description, type, default value, or range.
metrics_meta:- Specification of metrics calculated by the evaluator with name, description, range or threshold.
keywords:- Keywords specifying the evaluator compatibility and capabilities.
JSON evaluation results is a machine-readable file that contains evaluation results LLMs and RAG systems. The purpose of this JSON output is to provide a standardized, comprehensive record of an evaluation, which is valuable for programmatically analyzing performance.
The file is organized into three main sections:
results(detailing test case-specific data like inputs, actual outputs, and metric scores),models(providing information on the evaluated LLM/RAG system and its configuration), andevaluator(describing the evaluator's parameters, metrics, and capabilities).
This structured format allows for easy access to and analysis of a model's performance on a given test suite, facilitating a deep understanding of its strengths and weaknesses. The key benefit is the ability to conduct automated analysis, track performance over time, and compare different models effectively.
- Submit and view feedback for this page
- Send feedback about H2O Eval Studio to cloud-feedback@h2o.ai